xatra
- Quick start
- Documentation
- TODO (if you want to contribute!)
Quick start
Xatra (pronounced kṣatra), a tool for making historical maps – the data I have is currently focused on India (including Central and Southeast Asia), but I welcome expansions to the library. Installation:
pip install xatra
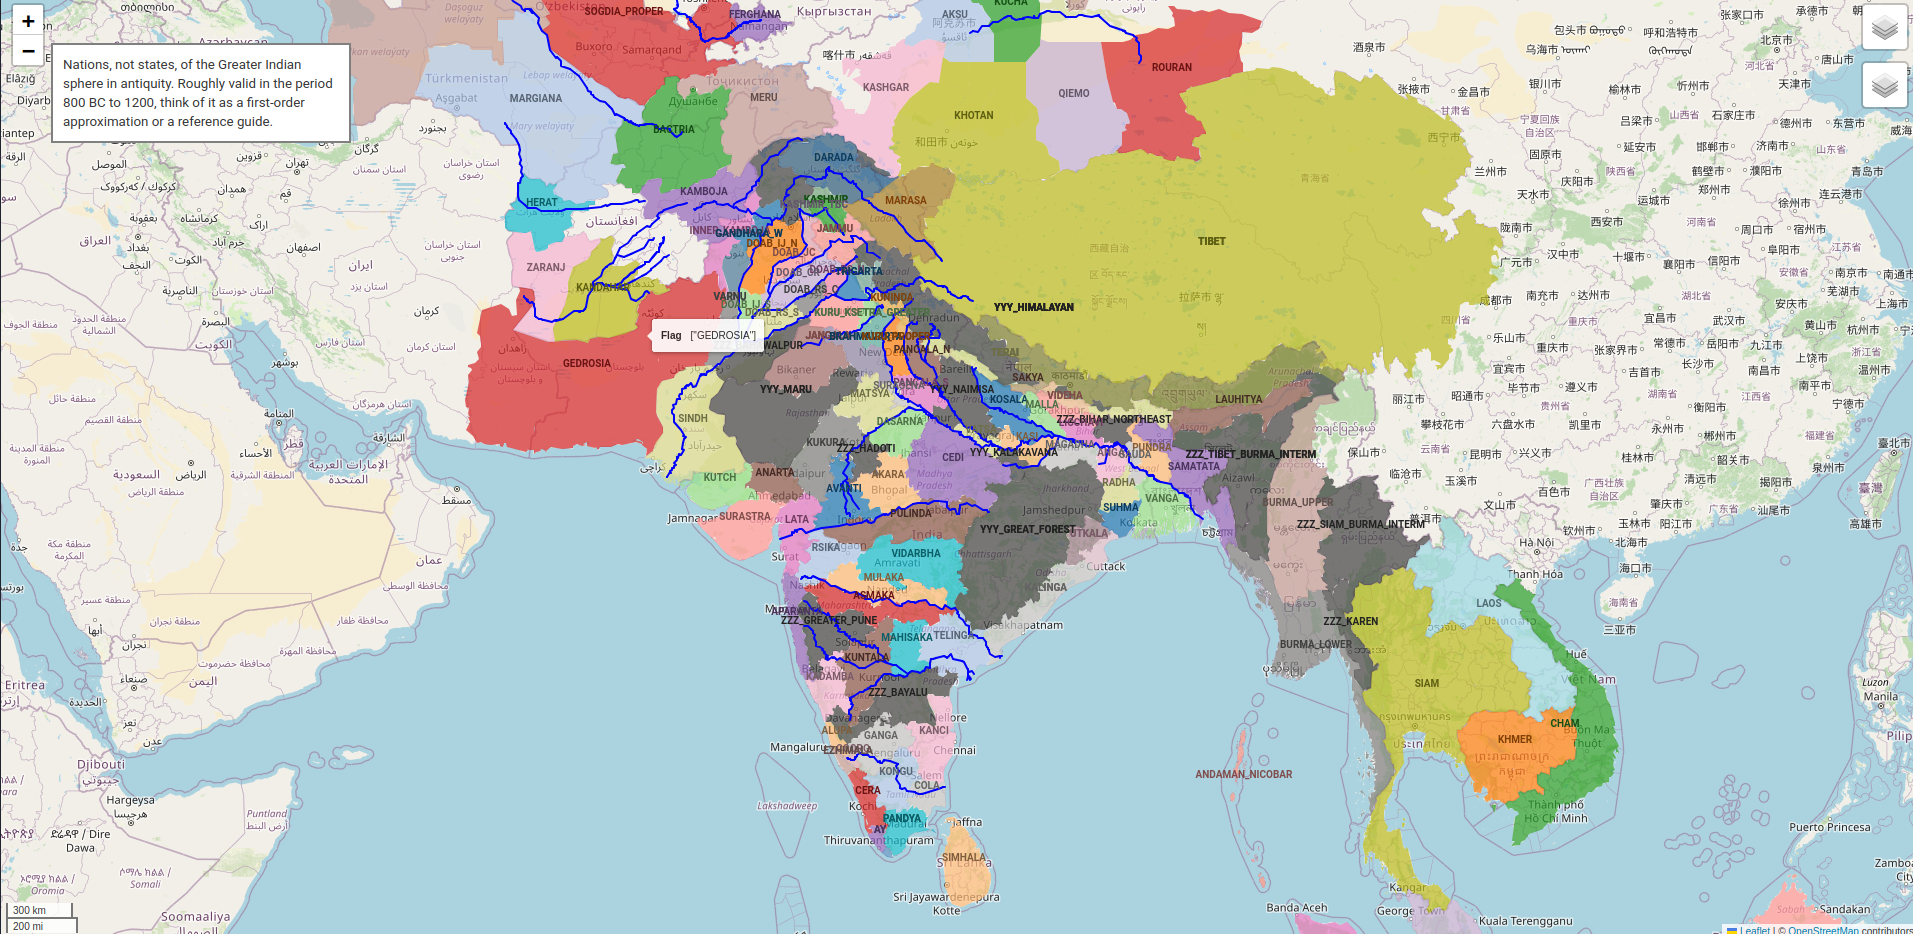
For a quick start, see examples.py e.g.
import xatra.maps.nations as nations
import xatra.maps.colonies as colonies

# any optional parameters may be set either while initializing a
# FlagMap object or in plot()

nations.INDIC.plot(path_out="examples/nations/INDIC.html")
nations.SILKRD.plot(path_out="examples/nations/SILKRD.html")
nations.SEA_GREATER.plot(path_out="examples/nations/SEA_GREATER.html")
nations.INDOSPHERE.plot(path_out="examples/nations/INDOSPHERE.html")
colonies.EARLY_SUVARNABHUMI.plot(path_out="examples/colonies/EARLY_SUVARNABHUMI.html")
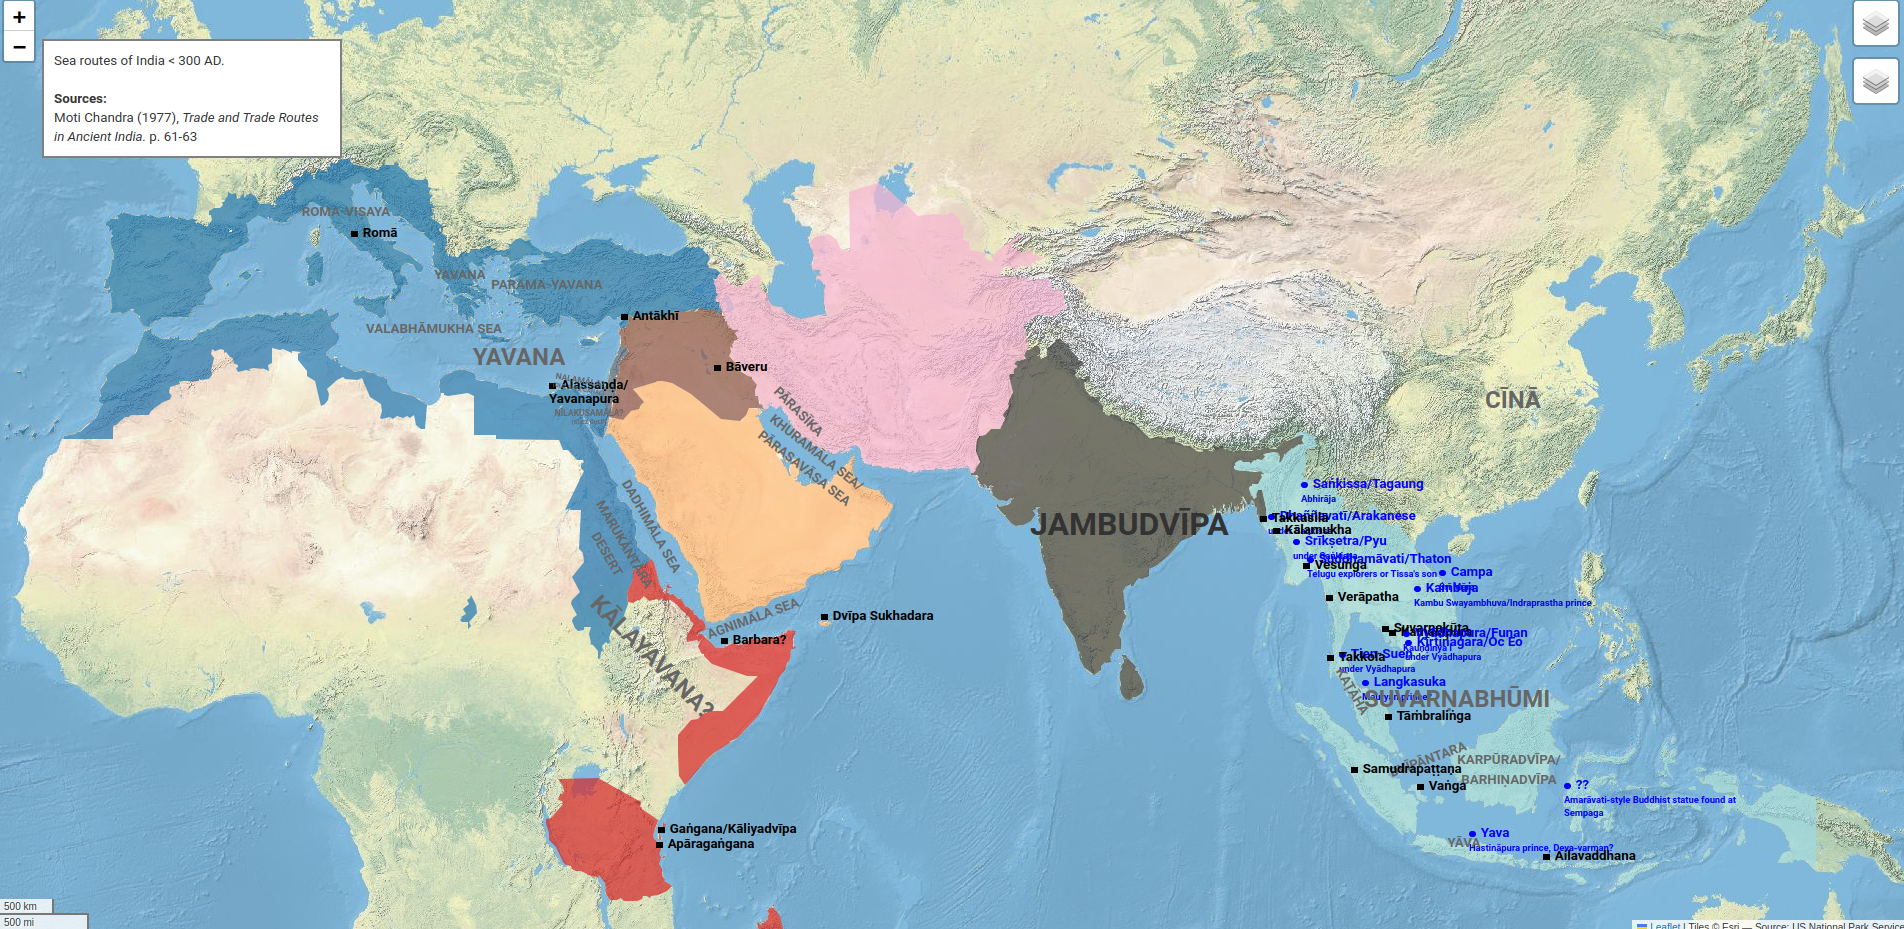
colonies.SEA_ROUTES.plot(path_out="examples/colonies/SEA_ROUTES.html")
mandala.MANDALA.plot(path_out="examples/mandala/MANDALA.html")


The outputs are in
- examples/nations/INDIC.html
- examples/nations/SILKRD.html
- examples/nations/SEA_GREATER.html
- examples/nations/INDOSPHERE.html.
- examples/colonies/EARLY_SUVARNABHUMI.html
- examples/colonies/SEA_ROUTES.html
- examples/mandala/MANDALA.html
Note: view this documentation,
- through the project website: srajma.github.io/xatra to see the visualizations properly
- through Github: github.com/srajma/xatra to see the code
Documentation
Key ideas:
xatra.FlagMap: Any historical visualization you’ll make is an instance ofxatra.FlagMap, which is fundamentally specified by a list ofxatra.Flags (plus some GeoJSON data)- It may be static, e.g. “map of ancient Indian Mahājanapadas”, “map of India according to Pāṇini”
- or dynamic, e.g. “map of India from 1300 BC to 500 BC, every year” or “traditional Puranic chronology”
xatra.Flag: Axatra.Flagis a declaration that a particular polity (Flag.name) ruled over some particular set of features (Flag.matcher), optionally for some particular specific period of history (Flag.period).name : str– the name of the historical polity.period : (num, num)(only for dynamic maps) – period for which the flag is valid, e.g.(-322, 500)= “322 BC to 500 AD” – inclusive of starting year but exclusive of ending year.matcher : xatra.Matcher– axatra.Matcherobject is basically a function that returns True or False for a given GeoJSON feature (dict or GeoPandas Row), i.e. the characteristic function for the set of features claimed by the flag.
from xatra.data import Loka, Varuna
from xatra.maps import Flag, FlagMap
from xatra.matchers import *

flags_sample = [
    Flag(name="Arjunayana", period=[-60, 80], matcher=KURU, ref="Majumdar p 29"),
    Flag(name="Kuru", period=[-1100, -900], matcher=KURU),
    Flag(
        name="Maurya",
        period=[-260, -180],
        matcher=(SUBCONTINENT_PROPER | country("Afghanistan") | BALOCH)
        - (BACTRIA | MARGIANA | MERU | KALINGA | TAMIL_PROPER),
    ),
    Flag(name="Maurya", period=[-260, -180], matcher=KALINGA),
]

SampleMap = FlagMap(
    flags=flags_sample,
    loka=Loka.INDIC,
    varuna=Varuna.INDIAN_SUBCONTINENT,
    custom_html="Sample map for demonstration",
)
sample.plot(path_out="examples/sample.html")
xatra.Matcher: A basically comprehensive list ofmatchers is given inxatra.matchers. Useful functions:country("India"),province("Maharashtra"),district("Nanded"),taluk("Hadgaon")etc. However you should usually use GADM Unique IDs to avoid name clashes – use examples/rdviz/INDIAN_SUBCONTINENT.html, examples/rdviz/SILKRD.html, examples/rdviz/SEA.html to easily find GIDs. Also note that for some countries like Pakistan and Nepal, “districts” are actually level-3 divisions and thus accessed bytaluk().- set operations:
|,&,-. Important to note that-takes precedence over the other operators in Python, so use brackets when needed. - Matchers for custom region names like
COLA,KOSALA,RS_DOAB,GY_DOAB,BACTRIA. These are quite comprehensive, you probably won’t have to define your own. See examples/matchers/INDIC.html, examples/matchers/SILKRD.html, examples/matchers/SEA.html, examples/matchers/INDOSPHERE.html for a visual overview of what I have.
-
xatra.DataCollection: The raw GeoJSON data we plot our flag lists on is stored in thexatra/data/directory and accessed through thexatra.DataCollectionclass and itsload()method inxatra.data. Useful DataCollections are inxatra.data.Lokaandxatra.data.Varuna. See examples/rdviz/INDIAN_SUBCONTINENT.html, examples/rdviz/SILKRD.html, examples/rdviz/SEA.html, examples/rdviz/WORLD.html to visualize the GeoJSON data. The only thing worth noting aboutDataCollections is that they can contain “breaks”DataItem(type="break", id="IND.20.20_1", level=3), which specify which features in the rawdata should be broken into even finer administrative detail – e.g. in the data right now, Nanded district in Maharashtra is broken into its taluks (because the ancient tracts of Asmaka and Mulaka contained different taluks of the district), and the districts of Xinjiang province are broken into their taluks (because the districts are too big and coarse, and contained multiple ancient Tarim city-states). - In summary, the code is quite small:
xatra.datacontains the Raw GeoJSONs for areas of interest to us and the class and method for loading them (DataCollection.load()). It also containsDataCollection.download(), which is used when preparing the package.xatra.maps.FlagMapcontains thexatra.Flagandxatra.FlagMapclasses. Also see therein the optional arguments that can be passed while initializing aFlagMapor toplot()(which overrides the optional arguments set during initialization).xatra.mapsis otherwise a directory of useful and interesting example Maps. This is where I would like PRs, more than anywhere else.xatra.matchers.Matcheris thexatra.Matcherclass, andxatra.matchers.matcherlibis a collection ofmatcherfunctions you can use in building your own Maps.
TODO
[UPDATE: moved to issues]
If you’re interested in contributing to this open-source project, please do so! This is just a side-project of mine, and I’m quite busy with real work to do everything I wish I could.
Ideally if you’d like to contribute, start a pull request and link to it on the relevant issue. I will review and approve pull requests daily. Here’s a to-do list of priorities you could work on:
- Slider-based control for dynamic maps – right now each year is just a layer which you can toggle by pressing the “down” key in the toggle. // Handling for dynamic (year-wise) maps is terribly inefficient: you create a new layer with GeoJSON data for each “breakpoint year” (year at which a territorial change occurs) – whereas the GeoJSON really remains the same in all the years, and only the styling and other properties should change. Even a tiny sample map I made examples/dynamic.html as an example is 14MB. I don’t think this can be fixed with Folium at all – maybe we need an alternate
matplotlibimplementation for dynamic maps, or work with Leaflet.js directly, idk. - Make example maps and visualizations:
- “nations” – classical nations of antiquity
- north-west circa 322 BC (panini, alexandrian records, puranic etc.)
- standard mainstream chronology, at least for some period (probably depends on better implementation for dynamic maps)
- early south-east asian colonies
- Fix design!!
- early sea trade routes
- continents of the world, names of india
- add Suvarnabhumi and Tibet-adjacent lands to matchers.py
- make everything verbose
- Loading all the stuff is really inefficient, fix that
- make legend options do something
- make flag name appear at center of geometry
- Fix
plot_flags()(which plots the merged geometry for each flag instead of plotting each district and colouring them to look the same) – and use it to calculate flag centroids too - Fix
plot_flags()to plot every intersection of flags so that more specific tooltips can be displayed. - handling for making cities appear on map (
data.Pura) - Make
plot_flagsfaster by directly calculatingflag_gdfinstead of fromloka_with_features - Allow custom JSON tooltips to be added at least in
plot_flagsOr descs below via kwargs inFlag,Label - For Matchers that can be vectorized, make them more effective [probably WONTFIX]
- change SEA to use level 1 features instead of level 2
- option to drop features with no flags
- custom_labels option
- add more stuff to Terai
- fix the double display
- rename trigarta
- add tibet to SEA
- fix tooltips on plot_flags_as_layers